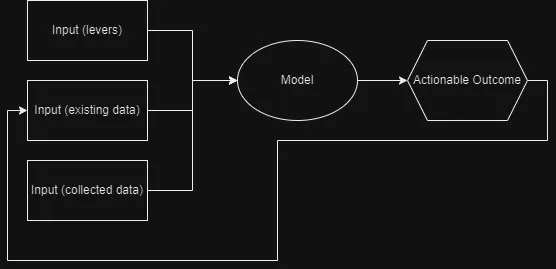
Based on https://www.oreilly.com/radar/drivetrain-approach-data-products/.
Predictive models are widely used nowadays in a large (and growing) number of products. Uber car arrivals, weather forecasts, chess, and even protein folding. But, predictions of the outcome do not always help to understand what steps to take based on the prediction.
To address that Jeremy Howard and others proposed an approach they called Drivetrain (a slightly confusing name that they say was inspired by the autonomous vehicles industry). The idea being that data now is no longer used to produce more data (in the form of predictions) but, akin to transmission, to produce movement or action, in the form of actionable outcomes. In other words, instead of being data-driven, we can now let the data drive us.
This is an important distinction. If you look at Google, for example, what they try to do with the search is to understand what a user is trying to achieve with a search query, and return an actionable outcome if possible (although recently Google, have become an evil empire instead of Microsoft, really only want you to see ads).
The drivetrain approach has 4 steps:
- Define the goal (objective): what outcome am I trying to achieve
- Define what inputs we can control: what levers can we pull to influence the outcome (these are controlled inputs, basically. In the case of a driverless car these are actual levers: the wheel, pedals, and gear lever)
- Define what data we need to collect: what new data we need to produce the outcome (these are uncontrolled inputs)
- Build the model: the model will reflect how levers and data we have collected affect the outcome

Certain businesses, like insurance companies or lending institutions, build their entire business on accurate prediction models (although they were not that accurate for many years and relied on guesswork).
Jeremy co-founded ODG (Optimal Decision Group) to work on this problem in the insurance industry, by applying the DriveTrain approach. They analyzed each component:
- Objective: maximizing net present value from new customers over extended periods of time
- Levers: price to charge each client, type of accidents to cover, how much to spend on user acquisition, and so on.
- Data to collect: to predict the outcome of different prices they had to randomly change the prices for many customers, thus making experiments
The first component of ODG’s Modeler was a model of price elasticity (the probability that a customer will accept a given price) for new policies and for renewals. The price elasticity model is a curve of price versus the probability of the customer accepting the policy conditional on that price.
The second component of ODG’s Modeler related price to the insurance company’s profit, conditional on the customer accepting this price. The profit for a very low price will be negative by the value of expected claims in the first year, plus any overhead for acquiring and servicing the new customer.
Multiplying these two curves creates a final curve that shows price versus expected profit. The final curve has a clearly identifiable local maximum that is the best price to charge for the first year.
The fact that the model has controls that can be manipulated, allowed ODG to build a simulator that can be used to ask ‘What If’ questions. What will happen if our company offers the customer a low teaser price in year one but then raises the premiums in year two? What if he then loses his home in an earthquake?
The results from the simulator are then fed to an optimizer to find an optimal solution and/or identify catastrophic outcomes and how to avoid them, thus creating an actionable prediction system.
In the words of Irfan Ahmed:
“When dealing with hundreds or thousands of individual components models to understand the behavior of the full-system, a ‘search’ has to be done. I think of this as a complicated machine (full-system) where the curtain is withdrawn and you get to model each significant part of the machine under controlled experiments and then simulate the interactions. Note here the different levels: models of individual components, tied together in a simulation given a set of inputs, iterated through over different input sets in a search optimizer.”
The drivetrain approach is a common pattern in marketing, for example, recommendation systems. These models are good at predicting whether a customer will like a given product, but they often suggest products that the customer already knows about or has already decided not to buy. The problem here is the objective: the system is recommending what is a customer likely to like, based on what similar customers bought. If we redefine the objective to: ‘What the customer is likely to buy that he hasn’t read already.’ Then, you could build two models for purchase probabilities, conditional on seeing or not seeing a recommendation. The difference between these two probabilities is a utility function for a given recommendation to a customer. It will be low in cases where the algorithm recommends a familiar book that the customer has already rejected (both components are small) or a book that they would have bought even without the recommendation (both components are large and cancel each other out).
Model Assembly line
The final step of the process is to build the Model Assembly line. The system can have several modelers, which outputs are combined to get a better final output.


